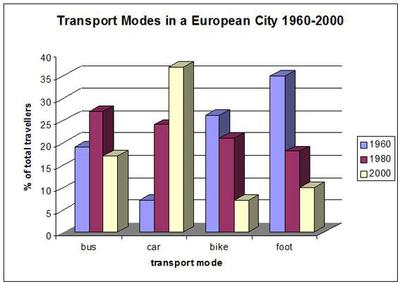
The given bar graph presents the percentage of total travellers, who used various types of transportation such as bus, car, bike and walking to travel and for work in a European city during the period from 1960 to 2000.
In the year 1960, car was least used as a method of transportation was around 7% using by population. The number of population who used car was grew steadily and in 2000 it was more than 35% . While, almost 34% European population had been chose walking to went to their destination in 1960.In the next 40 years, population was less interested in walking, it fell to 9%.
Analysing the data of remaining 2 modes of transportation, bike was preferred by a quarter of population to compared to bus. There was a gradual decrease in the percentage of bike and it was just 5% in 2000. Whereas, bus was preferred by only 17% of Europeans and the number was increased in the next years then decreased in 2000 was 15%.
Overall, car was most popular amongst European population, while bike and walking was least popular in the modes of transport.

No comments:
Post a Comment